Green Tip ~ Online Business Tip ~ Excel Tip
Unusual weather in August, although we do have the wind stripping the last leaves from the trees that are too lazy to let go of them! We have the prospect of an El Nino, which means another drought How can we start thinking about new solutions, changing how our economy works, creating jobs and educating people whom the education system has let down?
We are in crisis as the poles melt releasing methane and diseases into the world in greater and greater amounts. Earth Titanic is about to sink.
There are three products available - ArCADia LT, ArCADia 10 and ArCADia 10 Plus. They also have a full BIM solution and we can supply you with the brochure setting out exactly how it operates. Getting down to specifics, you can look at ArCADia for Architects, Distribution Boards, Electrical installations and so on. For more about them use this link.
Please contact Judith for more information and quotes.
Please note that your new Autodesk software has to be activated using your account logon within 30 days. Thereafter, please log onto your account monthly to receive the latest updates, so that your software stays current. You can use your account to access training videos and support via AVA as well. If AVA can't solve your problem, it can be escalated to Autodesk Support who will phone you to sort it out. This is an exceptional development as it makes problem solving so much faster than previously.
As an Autodesk customer, you matter to them as well as to your reseller. More and more solutions are sitting on your customer account - please explore them!
You can also now receive support from the Distributor, contact Nathalie for this. Her email is Nathalie@worldsview.co.za and she will make sure that the technical people sort you out asap!
Starting August 7, everyone who has made an investment in Autodesk solutions can take advantage of additional value and workflow benefits available through the Collections.
From August 7 to October 25, if you have a current subscription of a standalone product like AutoCAD, Revit or Inventor Pro you can, at any point in your subscription term, move to a Collection and save 20% off the price for the remaining months of your existing term.
We know Google as the most popular search engine on the planet, but Google is now much more than searches. A lot of Google’s services are available without signing up, for example Google Search, watching YouTube, Google Books, Google Finance and Google Maps.
However, an account is needed for uploading videos to YouTube and for making edits in Google Maps, and using Gmail, Google+, Google Hangouts, Blogger and others.
Apart from the above, Wikipedia, the free encyclopaedia, lists the following services from Google: Activity tracking, AdWords, AdSense, Google+, Google Drive, Google Calendar, Google Hangouts, Google Wallet, Google Groups, Google News, Google Alerts, Google Sites, Picasa, and Google Photos.
Many of them require an account. We will introduce you to various of these in subsequent newsletters. For now, we suggest you start by creating a Google account: To create an account on Google (or find out if you have an existing account) click here. If you are signed in, you have an account. If not, click "Sign In" and see if there is an account. If not, use the option to create your Google Account.
[This tip first appeared in the Megaplex newsletter, "Doing Business in Sandton" (June 2018). Sign up here for monthly business tips.]
Please contact Judith for a full overview and pricing. Having just done month-end using the direct download from FNB into QBO (QuickBooks Online), I can only state that it made it so much easier to complete.
I am loving working on the Cloud version and looking forward to passing my exam very soon.
To give the pros and cons, just stop to read this:
So what’s the big fuss about QuickBooks Online and how does it compare to its desktop counterparts? Well first off, QuickBooks Online makes daily tasks easier, meaning less work for small businesses.
Maximizer has been our customer relationship management for over twenty years. It has been a source of staying on the ball and creating increasing sales. Maximizer is now in the Cloud! If you would like to obtain more information, please click this link.
|
|
We are looking at what is new in Excel 2016 for Windows Desktop, compared with Excel 2010. On the Insert ribbon, in the Charts group, there is a new button for PivotCharts. Earlier, we created a Pivot Table, and last time we modified it to look like this:
| Sum of Amount | Column Labels | ||||
| Row Labels | East | North | South | West | Grand Total |
| Cape Town | R116,000 | R166,600 | R282,600 | ||
| East London | R244,000 | R261,100 | R505,100 | ||
| Kimberley | R152,400 | R95,800 | R248,200 | ||
| Pretoria | R373,500 | R373,500 | |||
| Grand Total | R489,500 | R152,400 | R506,400 | R261,100 | R1,409,400 |
To create a Pivot Chart from the Pivot Table, start by selecting the Pivot
Table. The right-hand sidebar will appear. Ignore it. On the Insert
ribbon, click the Pivot Chart button (shown in green on the picture). The
"Insert Chart" dialog will pop up: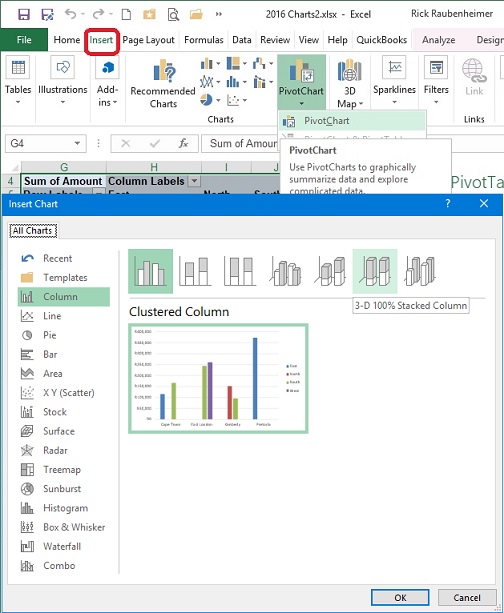
On the left, the Column type of chart is selected.
Across the top we see seven variations of column charts: Clustered Column, Stacked Column, 100% Stacked Column, 3-D Clustered Column, 3-D Stacked Column, 3-D 100% Stacked Column, and 3-D Column. Click on each one to see a larger representation of that one below.
Next time we will look at these Pivot Charts in more detail.
Definition of "Upgrade": Take old bugs out, put new ones in.
All the Best from the team!
Judith and Rick
Members, Communication in Action cc trading as Software Africa
"Empowering African Business with standard and custom PC programs, databases, and templates using Microsoft technologies"
Reg. 2009/007863/23 ~ VAT No 4500104387 ~ 126 Kelvin Drive, Morningside Manor, Sandton, 2191 South Africa.
Tel: 011 802-2685 / 011 802-6440 ~ Fax: 086-635-7902/3 ~ Cell: 082 389-3481/2 ~ e-mail: info@softwareafrica.co.za
|
This entire newsletter is Copyright ©
2018 Communication in Action
cc t/a Software Africa. All rights reserved. Information may be reproduced in full context as long as credit is given. |